You’ve seen the future of ray tracing and GPU rendering. Now learn how the GeForce RTX cards performed in Vlado’s benchmarking experiments, and what it means.
Overview
This is a follow-up blog post to our RTX ray tracing post. When we wrote our original blog post, the GeForce RTX cards were just announced, but we couldn’t share any specific benchmark results because the cards were not yet officially released.
Now that the cards are released, we can share the results from our experiments. We will only show results for the GeForce RTX 2080 and GeForce RTX 2080 Ti cards, along with the previous generation GeForce GTX 1080 Ti, as these are the top of the line.
All recent versions of V-Ray GPU already run on the new cards without problems, although they do not take advantage of the new RT Cores yet; we are working on this and you can read about our experiments below.
For these benchmarks we used the following scenes (some of the Evermotion scenes are modified from their originals):

ArchInteriors 13, scene 8

White room

ArchInteriors 13, scene 11

ArchExteriors 25, scene 2

ArchInteriors 33, scene 8

Lake Lavina
CUDA performance
For this first set of tests, we used the regular CUDA version of V-Ray GPU Next, which doesn’t use the RT Cores yet. We measured the pure CUDA performance of the RTX 2080 and RTX 2080 Ti cards and compared them to the GeForce GTX 1080 Ti, which is quite popular for GPU rendering right now.

As can be seen from these tests, the RTX 2080 and RTX 2080 Ti are usually faster than the previous generation GTX 1080 Ti. When comparing just the Ti cards, the results show that the Turing generation cards provide 1.52x speedup on average compared to the previous Pascal generation. These are the results you will get from the shipping versions of V-Ray Next.
RT Core performance
While we don’t have official builds supporting RT Core yet, we have been working with NVIDIA for quite some time to prepare V-Ray GPU for the new hardware. Currently, the RT Core support in our unreleased V-Ray GPU is based on OptiX, and an RT Core-enabled official release of OptiX is not yet available, so release builds of V-Ray GPU with RT Core support are still some time away. We can still do some performance testing with what we have today, but keep in mind that final performance will probably improve.
The tests below use an internal build of V-Ray GPU with RT Core support enabled. There are still many improvements that we expect will allow us to increase performance further.

For the three scenes, the RT Cores provide a speedup of 1.78x, 1.53x and 1.47x respectively compared to the pure CUDA version. We expect these results to get better as we get closer to the official builds in the coming months.
DXR performance
For this set of tests, we used our Project Lavina real-time ray-tracing engine which we first unveiled at Siggraph 2018. It is based on the DXR ray-tracing extension for DirectX 12 and is written from the ground up for real-time ray-tracing performance. The engine is based entirely on ray tracing, including shadows, reflections, refractions and a couple of bounces for GI, with a denoising pass to smooth the results. There is no rasterization involved at all and the RT Cores are utilized quite heavily. DXR is not supported on older GPU generations like the GTX 1080 Ti, so right now we can compare only the two available GeForce RTX cards.
The results for the DXR tests are in frames per second for HD resolution, so higher results are better:

From these results, the RTX 2080 Ti card provides on average 1.35x performance improvement over the RTX 2080 card; this translates into noticeably better responsiveness of the engine.
NVLink performance
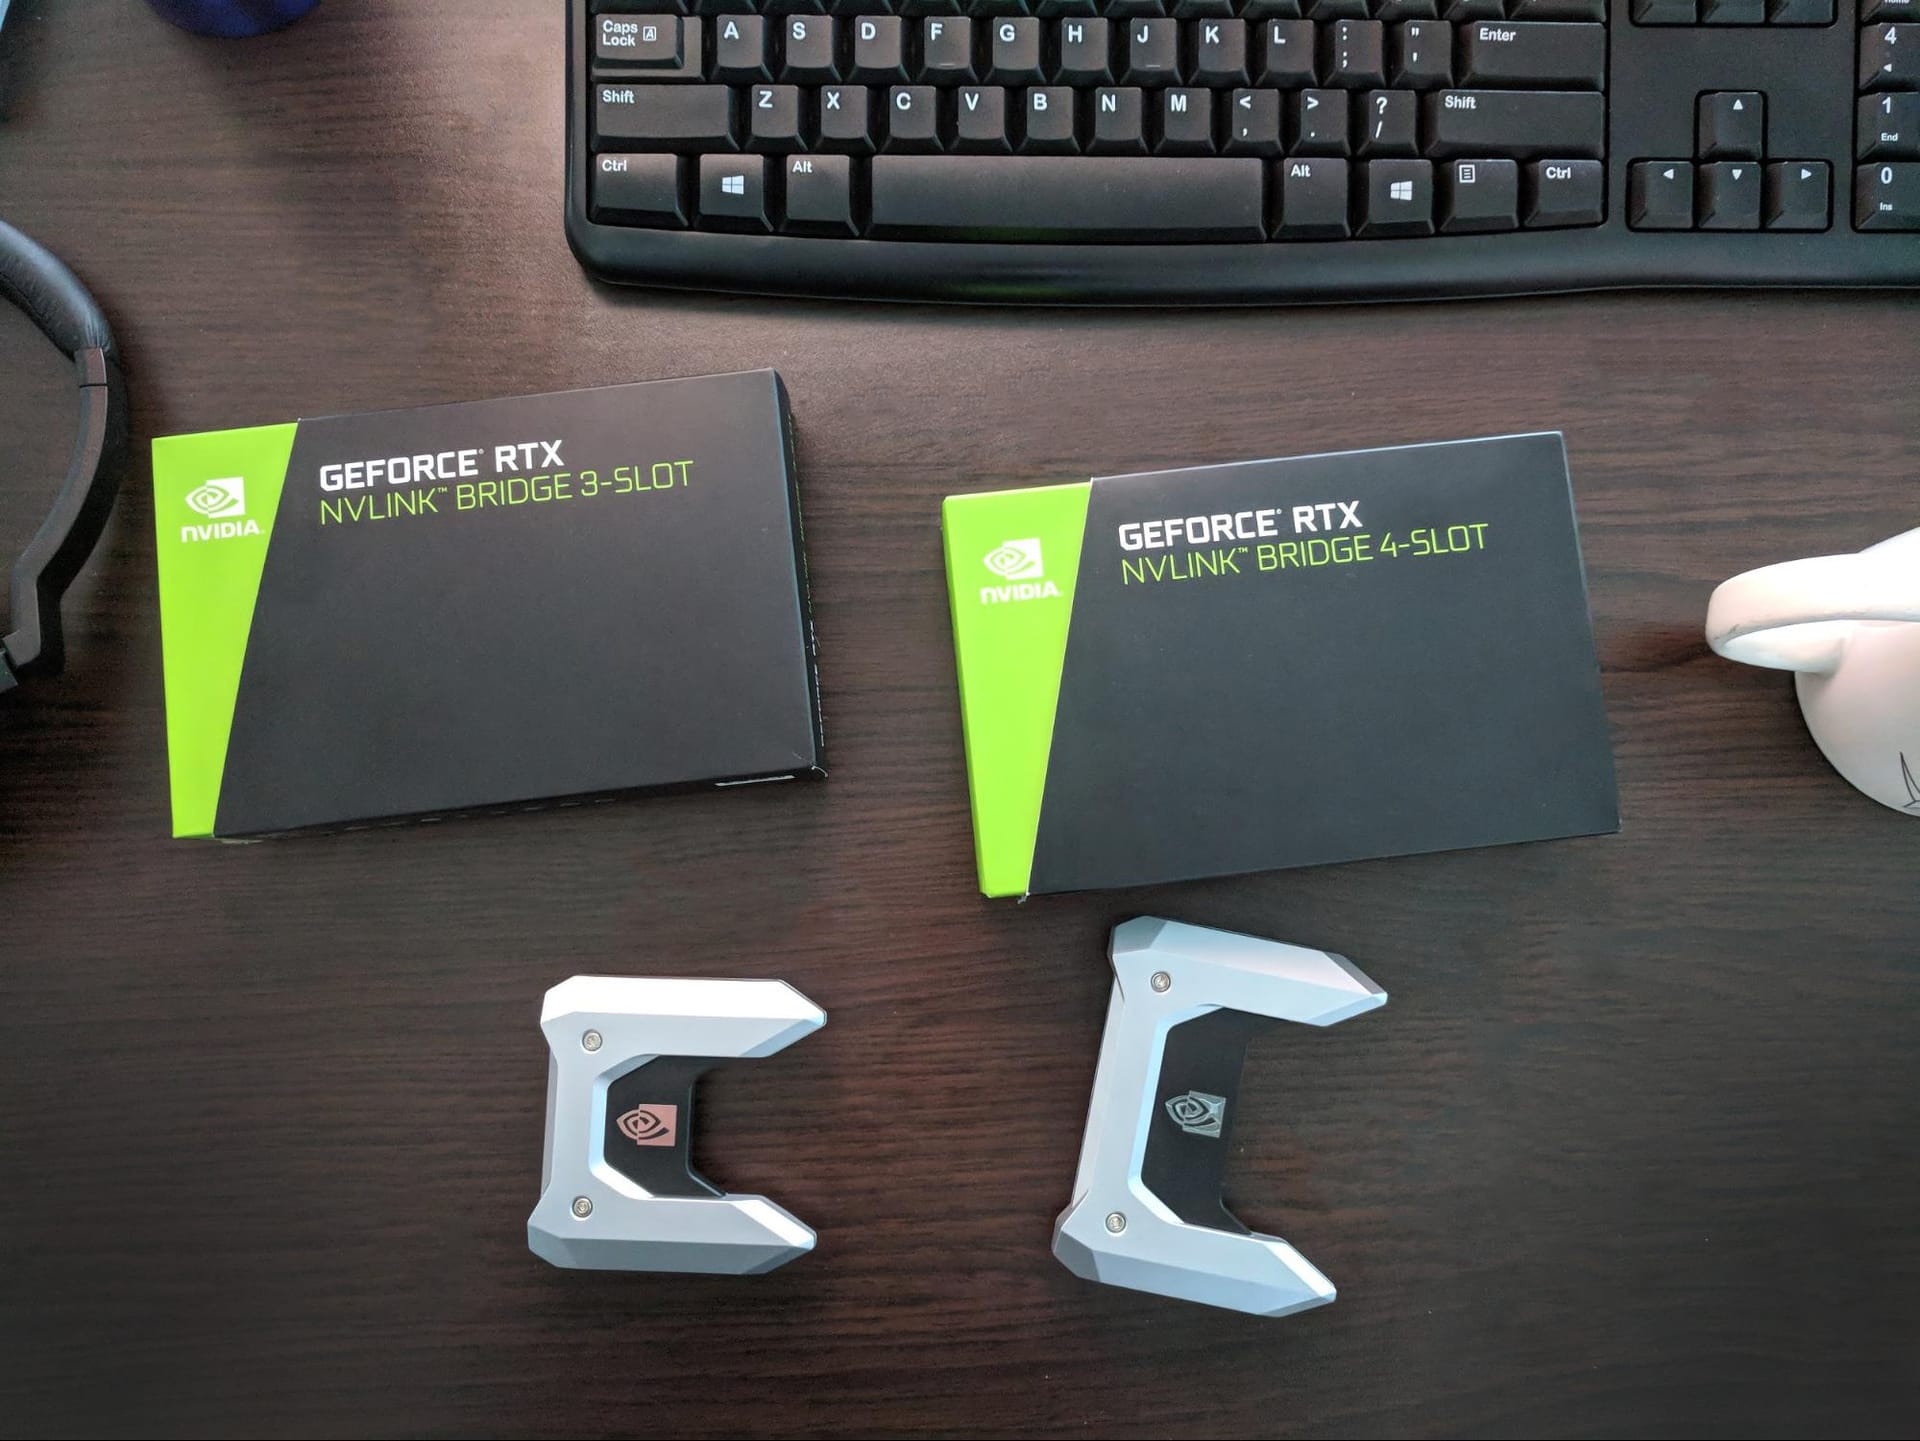
In addition to the RT Cores, the new RTX cards also support NVLink, which gives V-Ray GPU the ability to share the memory between two GPUs; this has some impact on rendering speed — and in this benchmark, we aim to measure it. In order to enable NVLink, the cards need to be connected with a special NVLink connector (also called NVLink Bridge). There are two types of connectors for GeForce RTX cards: three-slot wide and four-slot wide, depending on how far the cards are physically. The NVLink Bridges for Quadro RTX cards will be two-slot and three-slot wide respectively.
Three- and four-slot NVLink connectors for GeForce RTX cards:

Two RTX 2080 Ti cards connected with a four-slot NVLink connector:

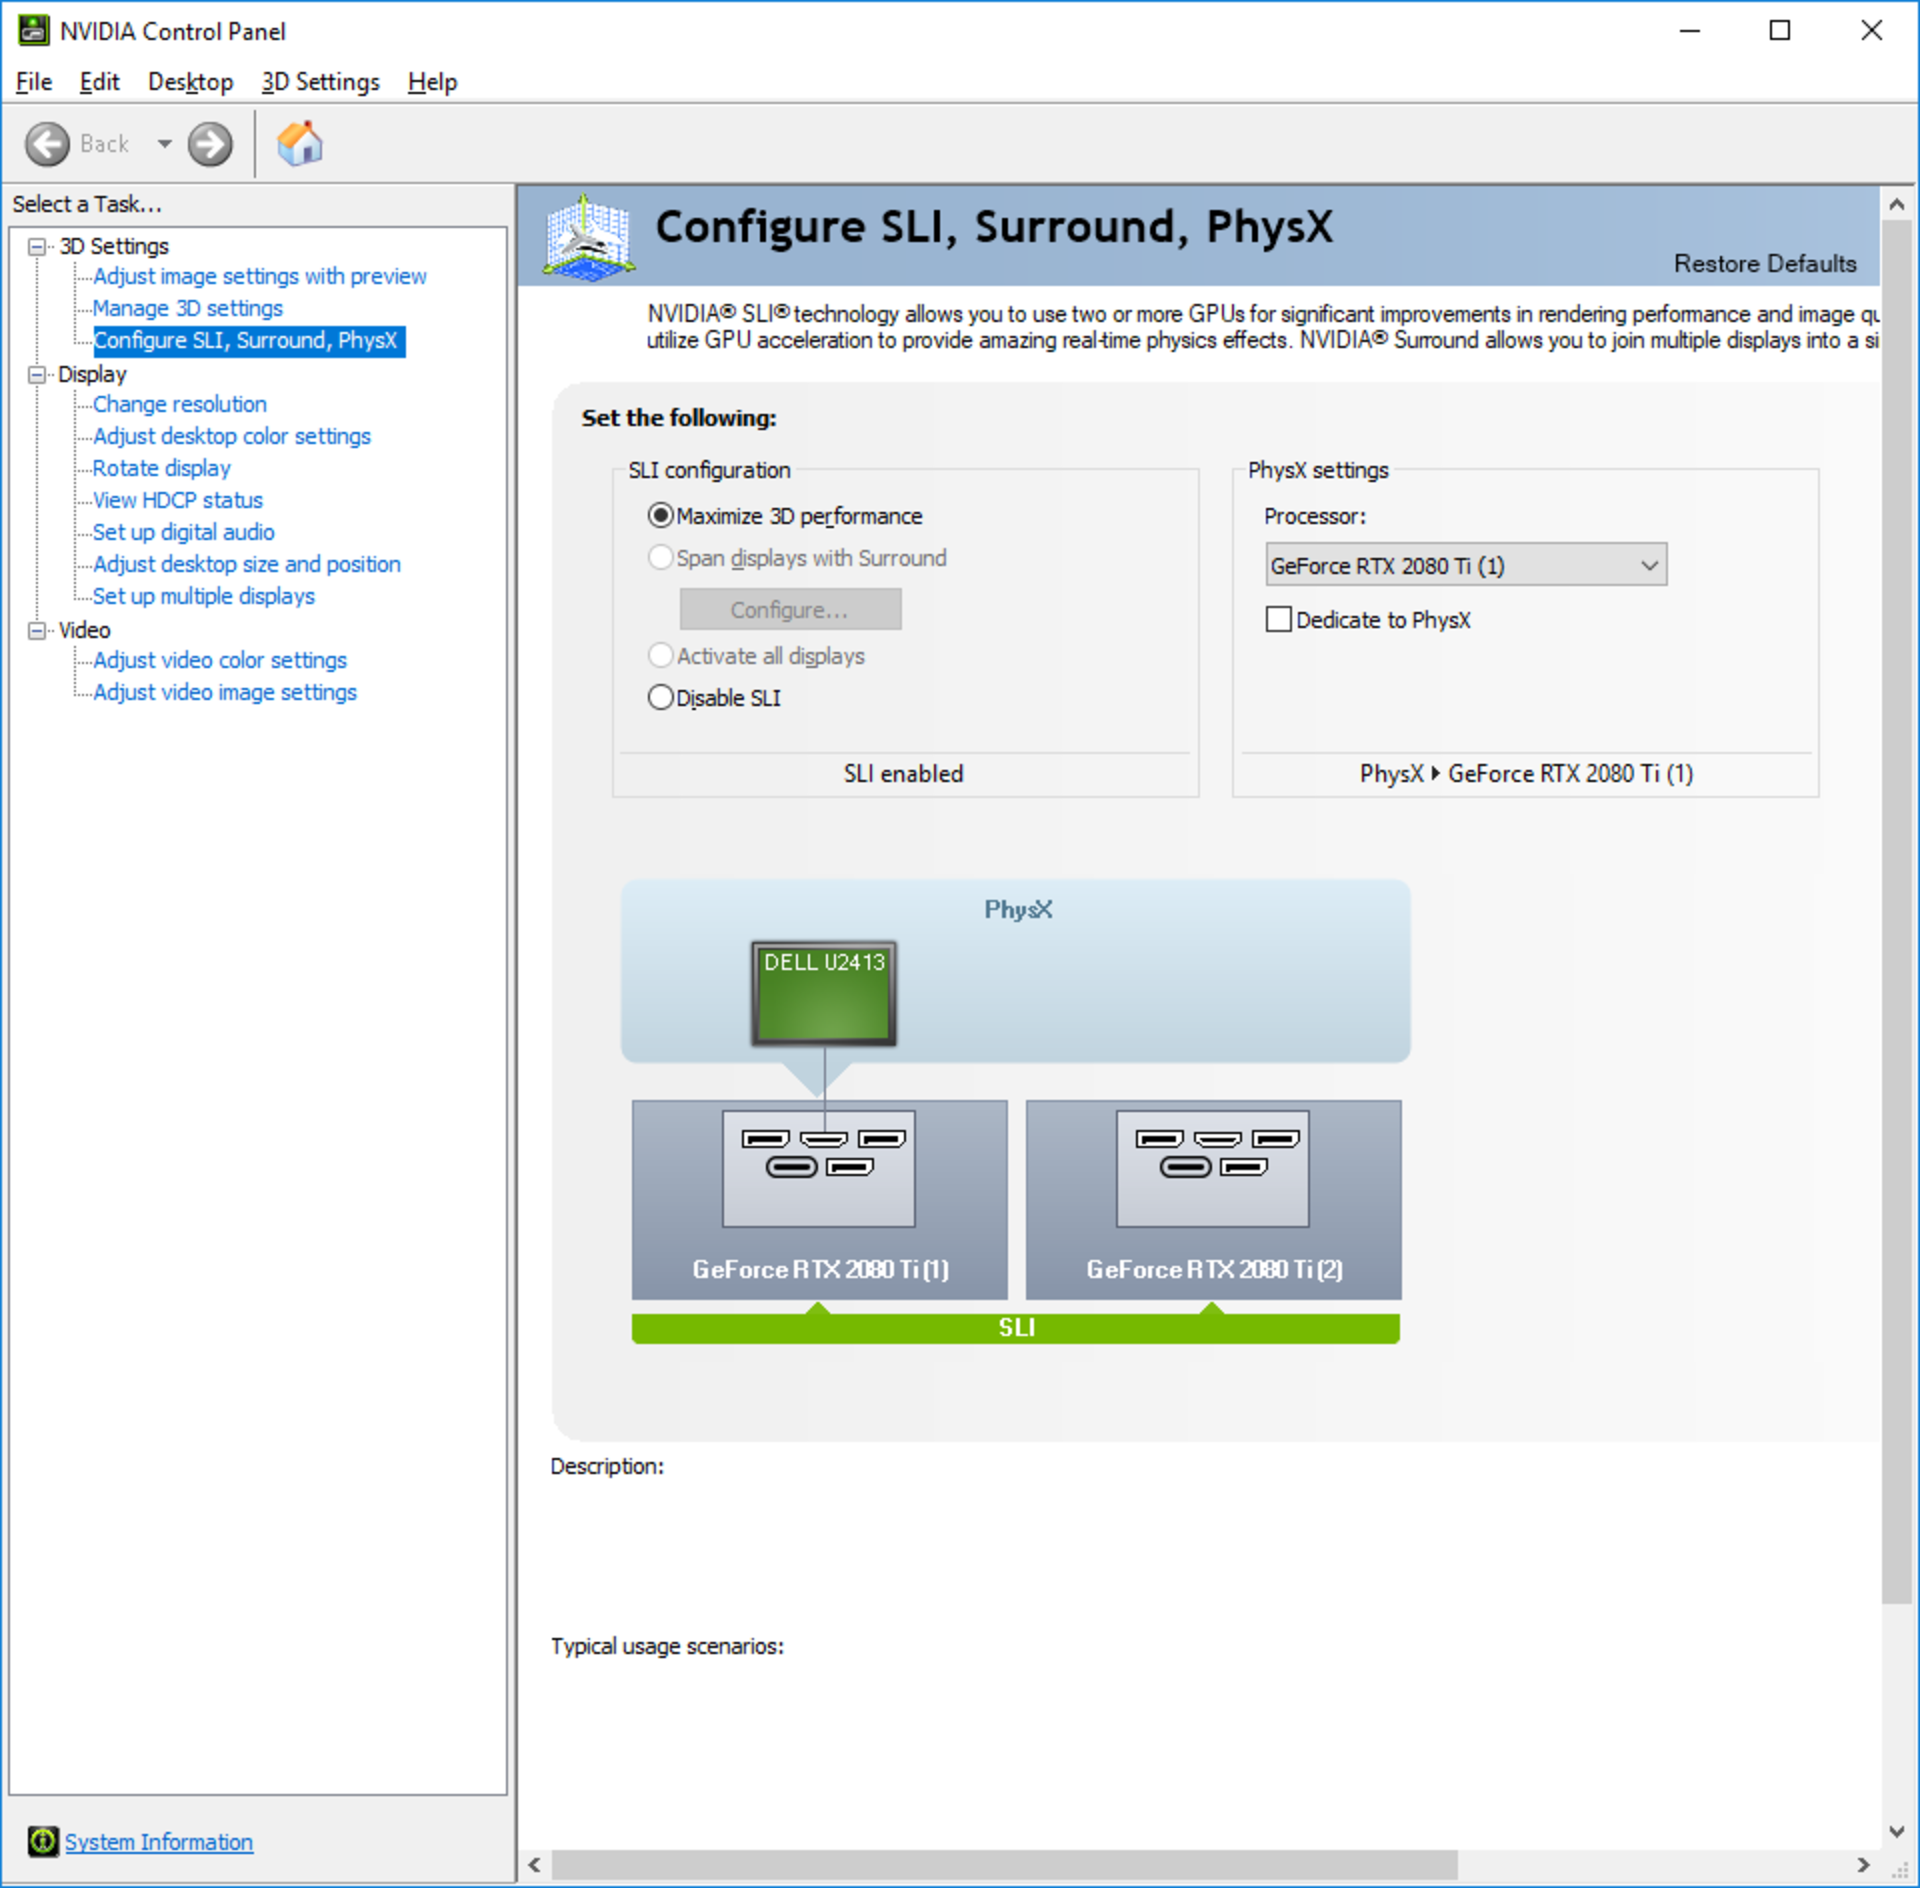
For NVLink to work on Windows, GeForce RTX cards must be put in SLI mode from the NVIDIA control panel (this is not required for Quadro RTX cards, nor is it needed on Linux, and it’s not recommended for older GPUs). If the SLI mode is disabled, NVLink will not be active. This means that the motherboard must support SLI, otherwise you will not be able to use NVLink with GeForce cards. Also note that in an SLI group, only monitors connected to the primary GPU will work. Additionally, if two GeForce GPUs are linked in SLI mode, at least one of them must have a monitor attached (or a dummy plug) so that Windows can recognize them (this is not required for Quadro RTX cards nor is it necessary on Linux).
Screenshot of NVIDIA control panel with SLI mode enabled (SLI mode is required for NVLink with GeForce RTX cards on Windows):

The NVLink speed is also different between the RTX 2080 and the RTX 2080 Ti cards, so we expect different performance hits from using NVLink.
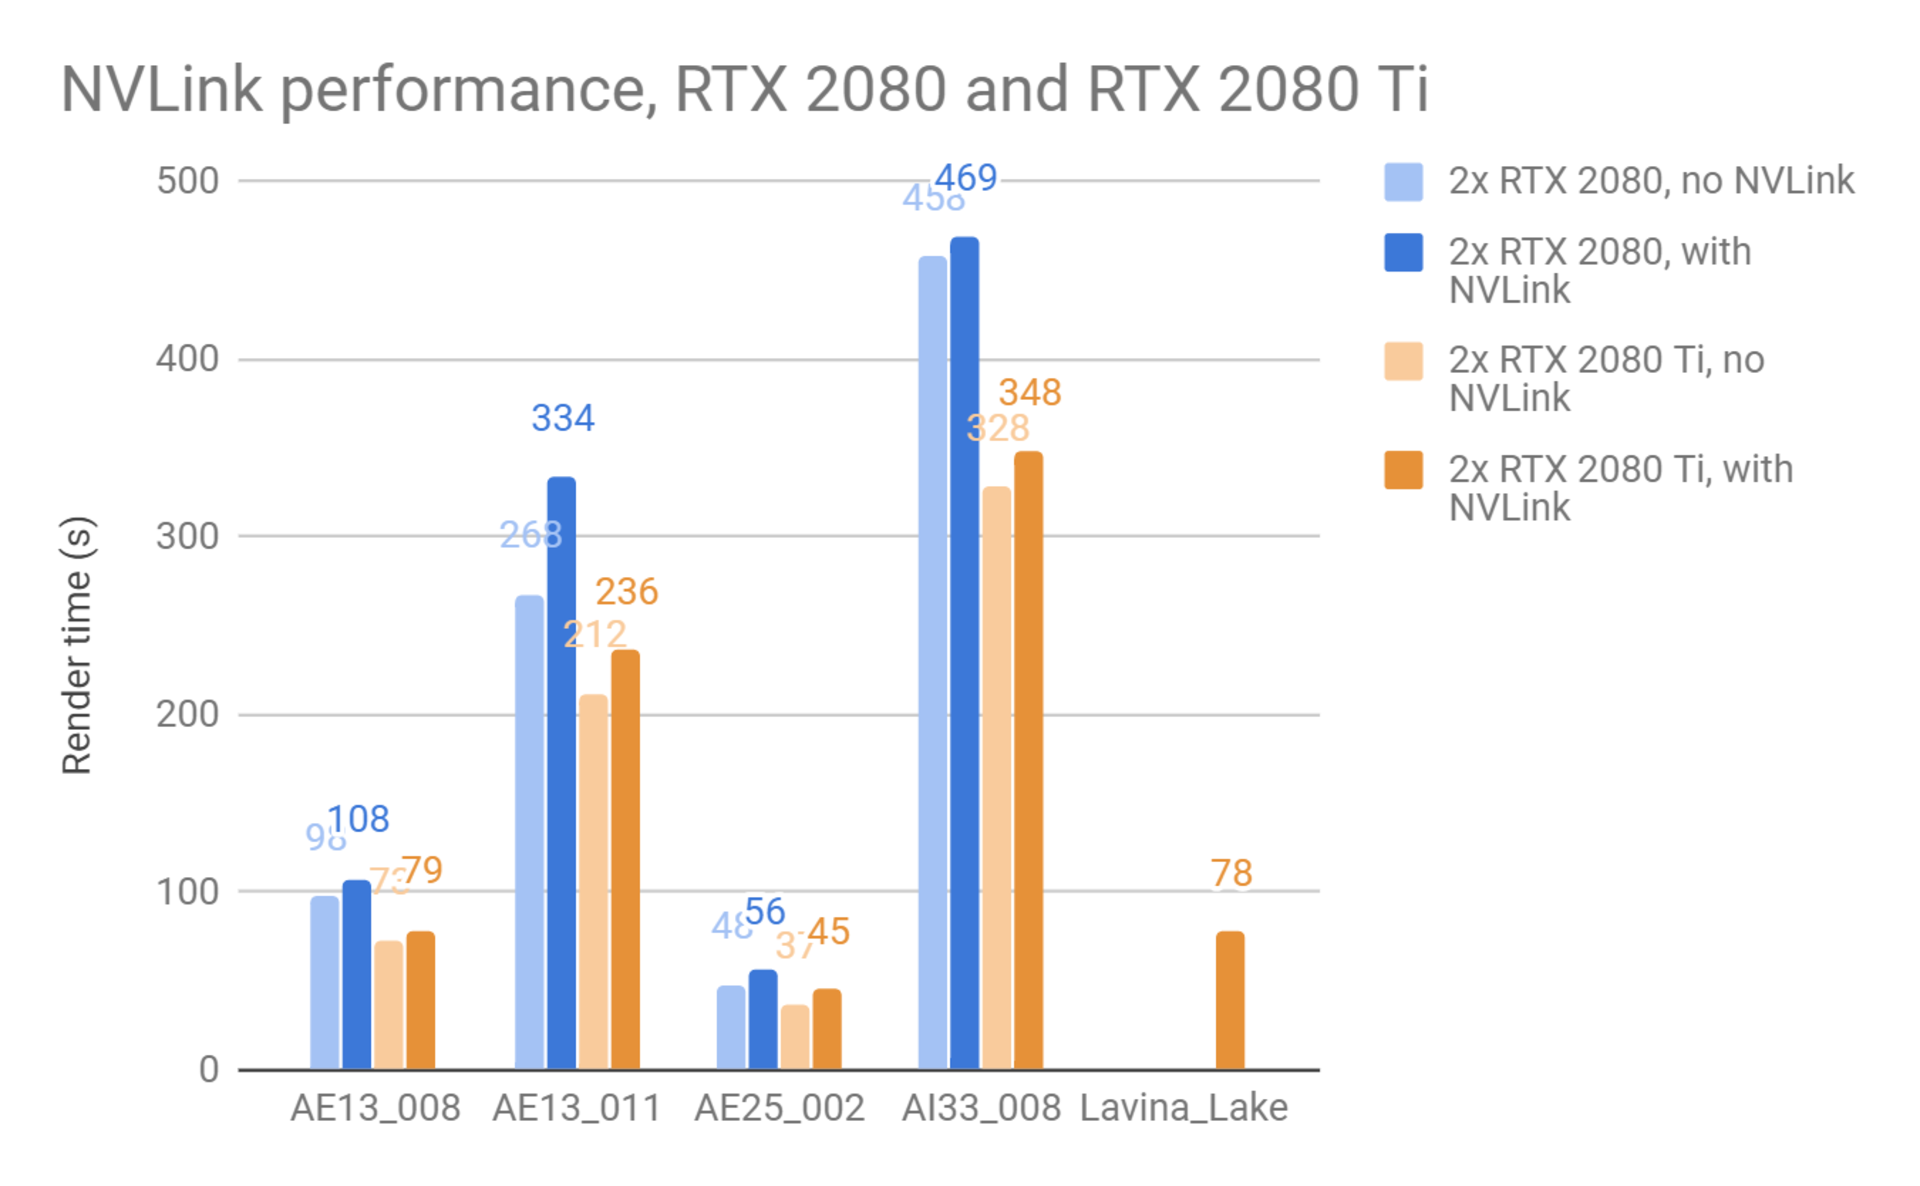
In the tests below, we rendered several scenes with the cards in SLI mode versus non-SLI mode to see what the performance impact of NVLink is. We used the regular CUDA version of V-Ray GPU for these tests. In some instances, the scene failed to render in non-SLI mode due to the limited RAM on each GPU separately.
Note that the available memory for GPU rendering is not exactly doubled with NVLink; V-Ray GPU needs to duplicate some data on each GPU for performance reasons, and it needs to reserve some memory on each GPU as a scratchpad for calculations during rendering. Still, using NVLink allows us to render much larger scenes than would fit on each GPU alone.

The last scene, Lake Lavina, could only be rendered in NVLink mode with the RTX 2080 Ti cards and failed to render in the other testing scenarios due to insufficient GPU memory. As can be seen, NVLink does introduce some performance hit compared to rendering on the GPUs separately, but it allows the rendering of far larger scenes. In many cases, the slowdown is only a few percent. Fine-tuning the way data is distributed between the two cards may provide even better performance in the future.
Important note: It seems like the regular GPU memory reporting API provided by NVIDIA currently (at the time of this writing) does not work correctly in SLI mode. This means that programs like GPUz, MSI Afterburner, nvidia-smi, etc. might not show accurate memory usage for each GPU. Knowing this, we have modified the memory statistics shown in the V-Ray frame buffer so you can track actual GPU memory usage there. We expect NVIDIA will correct these reporting issues in the future.

Free GPU memory as shown by an updated version of V-Ray GPU shows accurate memory numbers.

Nvidia-smi tool shows incorrect identical memory usage on both cards when SLI is enabled.

MSI Afterburner tool shows incorrect identical memory usage on both cards when SLI is enabled.
Accurate memory usage as reported by V-Ray GPU in the V-Ray frame buffer versus other system tools. Note that V-Ray GPU reports remaining free GPU memory as opposed to used memory.
Conclusion
Today, the new RTX 2080 cards provide better performance than the previous GTX 1080 cards with V-Ray GPU and the new inclusion of NVLink makes it possible to render much larger scenes with just a small performance impact. The new RT Core and NVLink technologies built into the RTX cards show a lot of promise for the future, but taking full advantage of them requires more optimizations and fine-tuning of the software, which we hope to see in the coming months.


